

We used social listening tools to find out how much support each of the major UK political parties were getting on the day of the EU elections.

Social networks, like Twitter, have revolutionised the way content marketers, like us, communicate with audiences..
Around 326 million people use Twitter every month, making it one of the best portals to deliver branded messages to a mass audience. But it’s also one of the best places to carry out audience research, too.
On average, 500 million tweets are sent every day around the globe, giving us insights geeks a huge wealth of information about the topics people are discussing and – importantly – how they feel about them. So we decided to run an experiment.
What if the EU elections were decided by tweets? And how do the results compare with the real-life results?
We used our pool of social listening tools to find out how much support each of the UK political parties were getting on Twitter on the day of the EU elections, Thursday, 23 May 2019.
But rather than trawl through the thousands of general tweets about each of the political parties during the election campaign, we focused on the ones made by users who named the party they had voted for.
Tweets that looked a little like this:
To make it a little more fun, we only analysed tweets on the day of the election – with each tweet considered a ‘vote’. Then, as in a normal election, we tallied up all the ‘votes’ to determine the results.
What were the final real-life results?
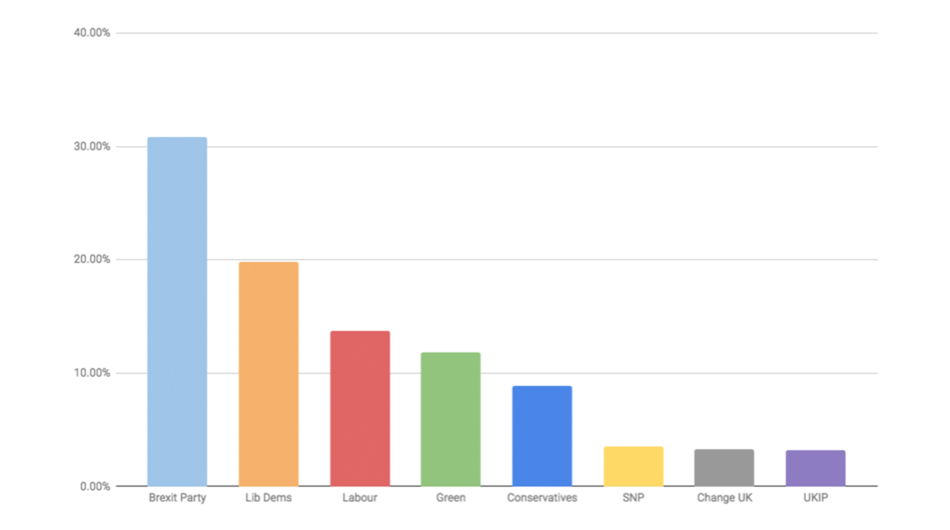
The final real-life results looked like this:
- Brexit Party 30.8%
- Lib Dems 19.8%
- Labour 13.7%
- Green 11.8%
- Conservatives 8.9%
- SNP 3.5%
- Change UK 3.3%
- UKIP 3.2%
What would the results have been if Twitter ‘votes’ had been used?
We analysed a pretty big sample for our study – 25% of all the relevant tweets that contained the words ‘I voted for’. It took some time to filter out the duplicate tweets, and tweets we considered to be from unauthentic accounts – mostly from spam bots.
But after some tinkering with the data filters, the final results from our Twitter experiment looked like this:
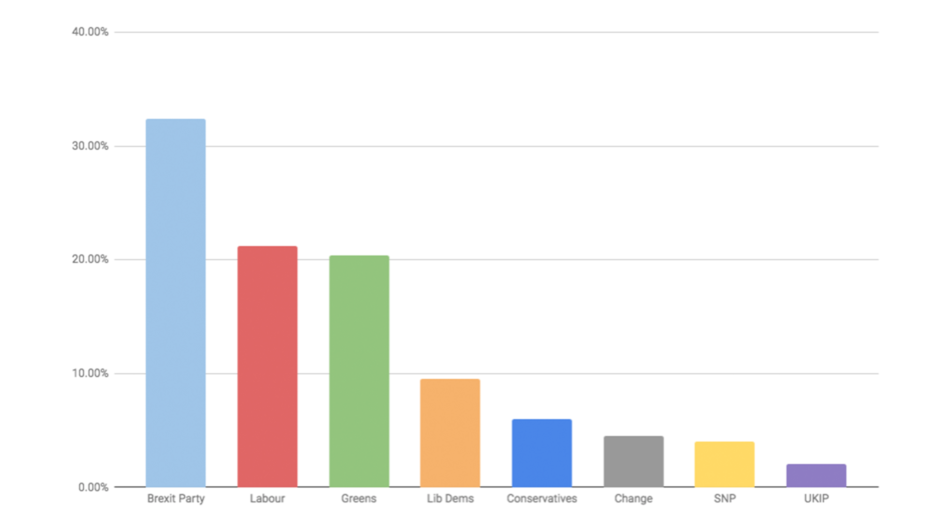
- Brexit Party 32.4%
- Labour 21.2%
- Green 20.4%
- Lib Dems 9.6%
- Conservatives 6.0%
- Change UK 4.5%
- SNP 4.0%
- UKIP 3.6%
How do the two results compare?
The first striking comparison is just how similar the two sets of results are. We were surprised a simple test like this reflected the official election result – albeit with some obvious differences.
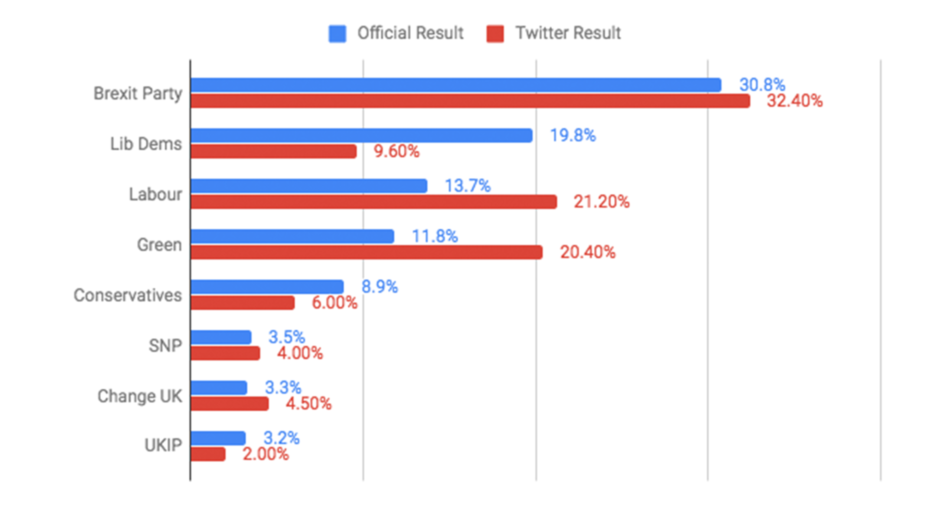
The Brexit Party came top in both sets of results, with a remarkably similar percentage of the vote. The bottom four parties – Conservatives, SNP, Change UK and UKIP – all stayed the same, with only the SNP and Change UK changing places in our Twitter result.
It’s again worth noting how similar the percentage of the vote was for the bottom four parties in both sets of results.
The major differences were seen in positions two to four, the Lib Dems, Labour and the Green Party.
Both Labour supporters and Green supporters were far more vocal about their votes on Twitter – as you can see from how different those parties’ real EU election results were from the results of our study.
Supporters of the Lib Dems in this election, on the other hand, were far less likely to shout about their vote. In fact, our results show they are the party with the most silent supporters – there’s more than a 10% difference between the two sets of results.
What was motivating people’s votes?
Predictably, it looks as if Brexit was the main motivator for people’s votes. Both the terms ‘leave’ and ‘remain’ appeared regularly in our set of studied tweets – suggesting why parties with a firm stance on Brexit performed so well.
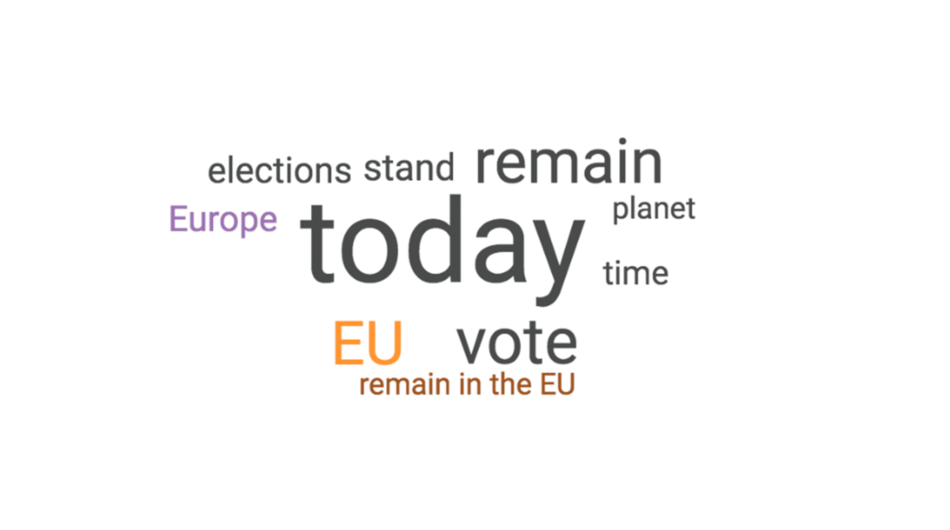
One other interesting word that came up regularly in the tweets we studied was ‘planet’. There has been a huge focus on the environment recently, with climate protests from the Extinction Rebellion movement and criticism of single-use plastics featuring high in the news agenda.
It would suggest that the environment was another main motivator for people’s votes – and maybe why the Green Party also performed well in both the official election and our Twitter study.
What do the results mean?
We think the results show that social listening tools are a reliable way of authentically measuring the way the public feel about a huge range of topics, from political parties to both big and small brands.
River currently uses social listening tools to help brands understand how their audience feel about them and their industry as a whole. We use the data for a range of purposes, including influencing a brand’s content strategy and notifying them of industry trends.
If you would like to find out more about how we could do this for your brand, get in touch with the River digital team at digital@therivergroup.co.uk.